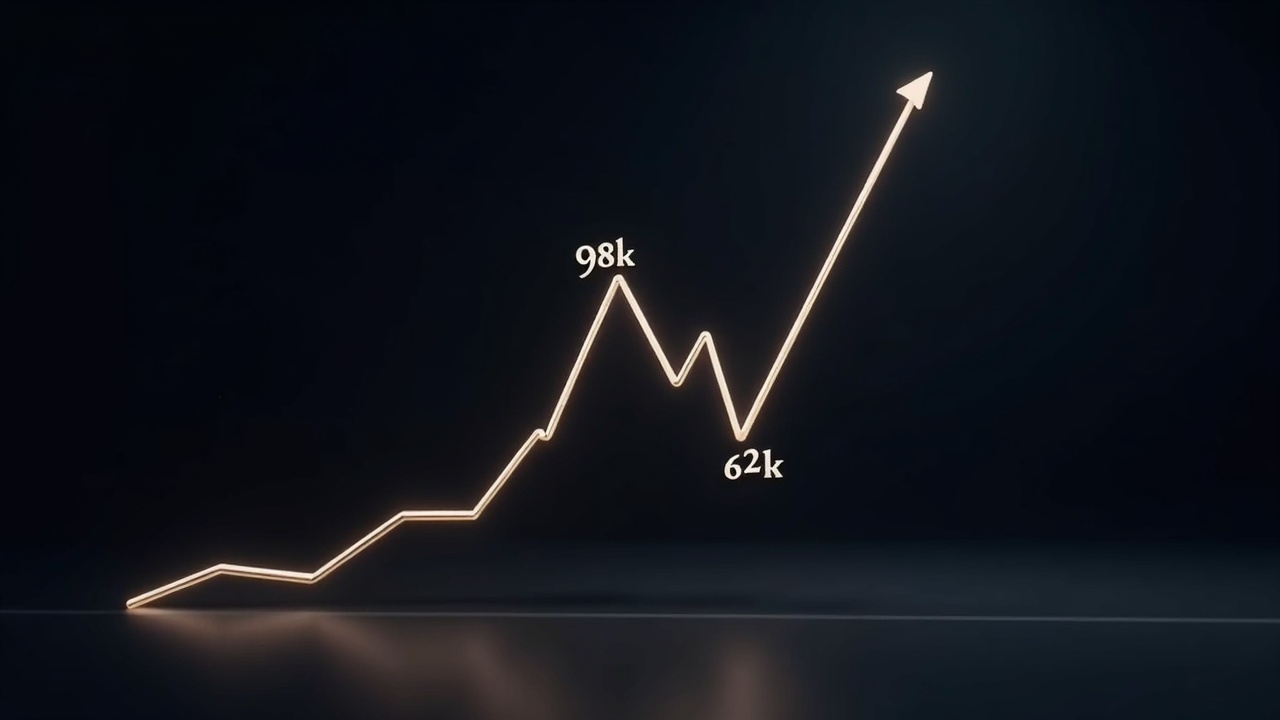
Veteran trader Peter Brandt issued a bearish technical outlook on January 19–20, 2026, warning that Bitcoin could drop more than 30% from recent levels. Brandt’s chart-based projection pointed to a $58,000–$62,000 target range, implying roughly a 33–37% decline from the approximately $92,400 reference price he cited.
His warning focused on a rising-wedge formation and Bitcoin’s failure to reclaim key resistance in the $98,000–$102,000 zone, including a highlighted level around $102,300. In Brandt’s framing, repeated rejection in that band increases the probability of downside acceleration rather than a quick continuation higher.
58k to $62k is where I think it is going $BTC
If it does not go there I will NOT be ashamed, so I do not need to see you trolls screen shot this in the future
I am wrong 50% of the time. It does not bother me to be wrong pic.twitter.com/NDOuSrqLwa— Peter Brandt (@PeterLBrandt) January 19, 2026
The Technical Setup Brandt Is Highlighting
Brandt’s thesis rests on price structure over the prior two months, where he identified a rising wedge and treated it as a bearish configuration unless resistance is decisively reclaimed. He specifically argued that inability to clear the $98,000–$102,000 area, with $102,300 as a focal point, would intensify bearish momentum.
From the levels he referenced, Brandt extrapolated a move toward $58,000–$62,000 and framed it as a deep correction risk for participants positioned at higher entries. The practical takeaway is that the wedge and resistance band define the risk envelope more than day-to-day volatility.
Brandt’s post used clear reference markers: a projection base near $92,400, resistance at $98,000–$102,000, and a downside target range at $58,000–$62,000. These levels function as the decision points that traders and risk managers can map directly into positioning and hedging rules.
Credibility, Uncertainty, and Market Implications
Brandt’s historical credibility amplified attention to the call, including prior recognition for warning about the 2018 crash. At the same time, he openly tempered expectations by noting he is “wrong 50% of the time” and would not be “ashamed” if the forecast fails, reinforcing that technical projections are probabilistic.
Market reactions around January 19–20 were mixed, with some observers seeing echoes of prior corrective phases while others pointed to macro liquidity conditions that bottomed in late 2025 as a potential counterweight. The divergence underscores that technical structure interacts with liquidity and institutional flow rather than dictating outcomes in isolation.
For institutional and professional investors, the operational read-through is conditional: sustained failure to reclaim $98,000–$102,000 would likely compress risk appetite and raise volatility, while a decisive break above that band would weaken this bearish case. In execution terms, the resistance zone is the pivot that can shift positioning, implied volatility, and market depth.
Investors are now watching whether Bitcoin can regain the $98,000–$102,000 area and how liquidity indicators that bottomed in late 2025 evolve in parallel. The combined trajectory of price structure and liquidity conditions will shape institutional flows and risk posture over the coming weeks.